Social media marketing has made a huge difference in the way businesses (large and small) operate. The success stories we’ve encountered over the years since SMM entered the picture are certainly worth replicating. Who doesn’t love social media benchmarks? With the right strategies in place, these benchmarks basically catapult businesses into the spotlight and into the supportive arms of dedicated customers.
This year’s Social Media Industry Benchmark Report is one of the most comprehensive versions ever. It includes 1,800 surveys of leading brands and companies, giving a closer look into factors that influenced their social media success.
The Benchmarks:
Metrics cover 12 of the most in-demand industries between January and December 2018. These industries are as follows:
1) Alcohol 2) Fashion 3) Health & Beauty 4) Food & Beverage 5) Home Design 6) Higher Education (i.e. Graduate & Post-Graduate Degrees) 7) Hotels & Resorts 8) Nonprofit Organisations 9) Retailers 10) Media 11) Influencers 12) Sports Teams
The report provides tips on how to benchmark successful and workable social media strategies across three major social platforms: Facebook, Twitter, and Instagram. Also featured are several insights concerning social media engagement, which has drastically altered in the last few years for the 12 aforementioned industries. These tips and insights will hopefully help you improve and modify your SMM campaign for the year 2019.
Furthermore, besides the social media statistics (e.g. best posts, most engagements, etc), the reports took into account two new industries this 2019 – the Alcohol and Retail industries and paid keen attention to Twitter hashtags.
Here’s how the benchmarking process will start.
Social Media Benchmark: Methods, Practices & Approach
How to spot social media benchmarks with the overwhelming amount of data you encounter on a regular basis? To avoid confusion and for more clarity, the report focused on the top 3 biggest SNS platforms: Facebook, Twitter and Instagram. A tool called Rival IQ was used to unravel the mystery behind engagement rates, regularity or frequency of posting activities, post variations, and hashtag trends.
Social media engagement was described as a “measurable interaction on social media posts”, which includes commenting, liking, retweeting, sharing, and other similar activities. To calculate the engagement rate, interactions will be summed up and divided by an account’s overall follower count.
Please take note of the 12 industries listed above. Note that the previous report only had 10 industries. Now, the list has expanded and is more comprehensive.
The report consists of samples of national and international companies that represent each industry in the list. The sampling method covers a total of 150 companies, randomly selected from a database of more than 150,000 companies. All the companies in the list are active on Facebook, Instagram, and Twitter with page like counts of around 25,000 to 1 million as of January 2018.
The median performance was utilised from the companies randomly selected for each industry to provide data analytics for the said report.
Click here to download Rival IQ's 2019 Social Media Benchmark Report.
The Purpose of Benchmarking
There’s more to social media success than simply getting a lot of comments or profile clicks. What matters most is engagement. Specifically, increasing user engagement while simultaneously expanding or maintaining your audience’ engagement percentage.
The main focus of this benchmarking study is authentic social media engagement rates – not “vanity metrics”. Vanity metrics pertain to digital marketers’ focus on follower counts instead of real audience interest. We all know that savvy social marketers want to know where they stand in the competition. And this is basically due to the fact that benchmarks are relative.
Basically, all main industries are being considered, plus various social media stats, and companies representing each of the 12 industry to ensure you gauge your own performance based on true median performance.
Please read the full report here so you can properly compare your social media stats in real-time. Interactive reports provide live SNS benchmarks and metrics from the sample companies representing the 12 industries. You’ll have a clear idea of top-performing hashtags, post types that earn the most engagement, and so on. All these metrics are legitimately derived from Facebook, Instagram, and Twitter social media activities.
But if you still need more benchmarking information, here’s a no-cost Head-to-Head report that will help you analyse your competition. This report will also help you gain a deeper understanding of social media benchmarks represented in this study.
What about Facebook engagements?
Of the top three social media platforms mentioned above, which one should you be most wary of? If statistics were to be taken into consideration, then you might want to lay low on Facebook ads. Assuming you’re putting all your eggs in this basket.
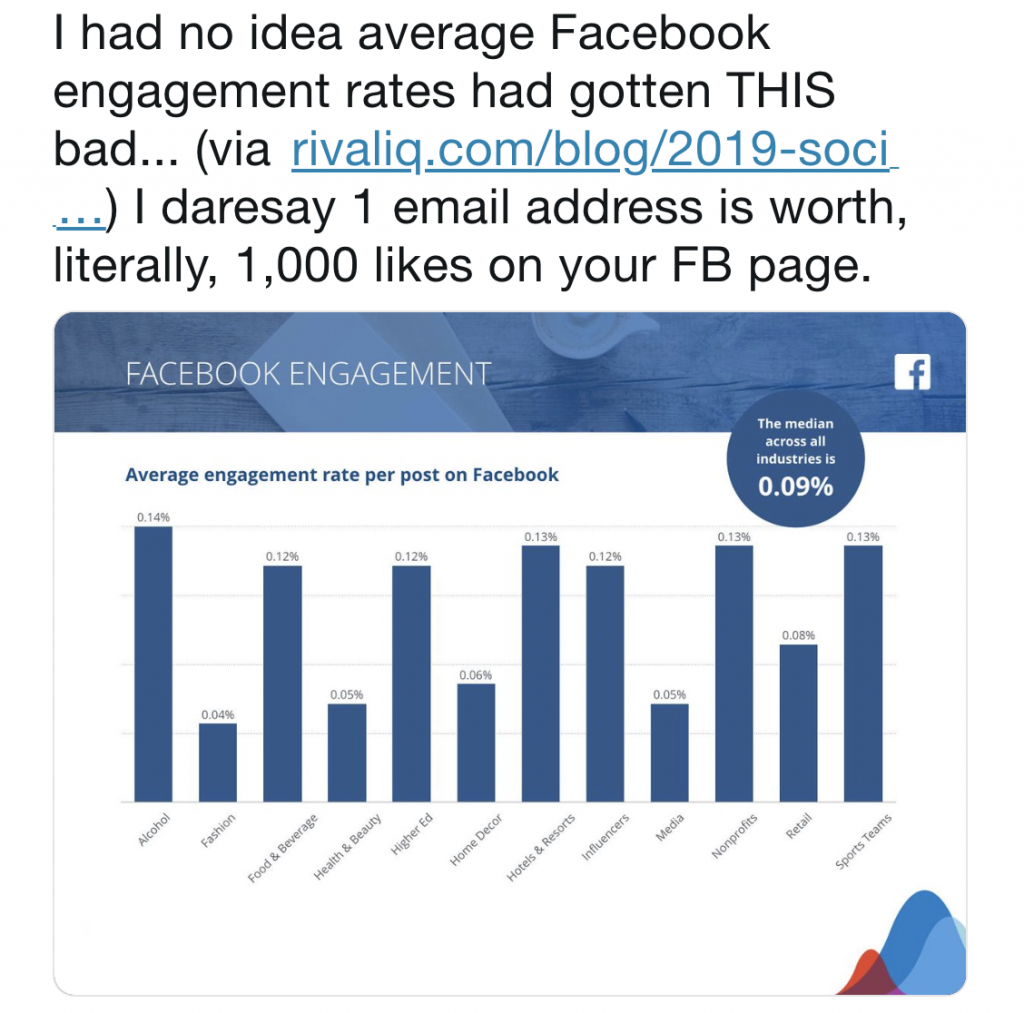
And as per recent statistics, Facebook engagement rates are currently at an all-time low. And why is that, you ask? There are many possible answers to this question.
First, the issue of privacy. Many account holders lost their trust in the social media platform after a string of private data leaks and hacking-related cases, which even led Mark Zuckerberg to appear in front of the U.S. Senate for interrogation.
Also, this data will show you just how much Facebook engagement rates have deteriorated over the years:

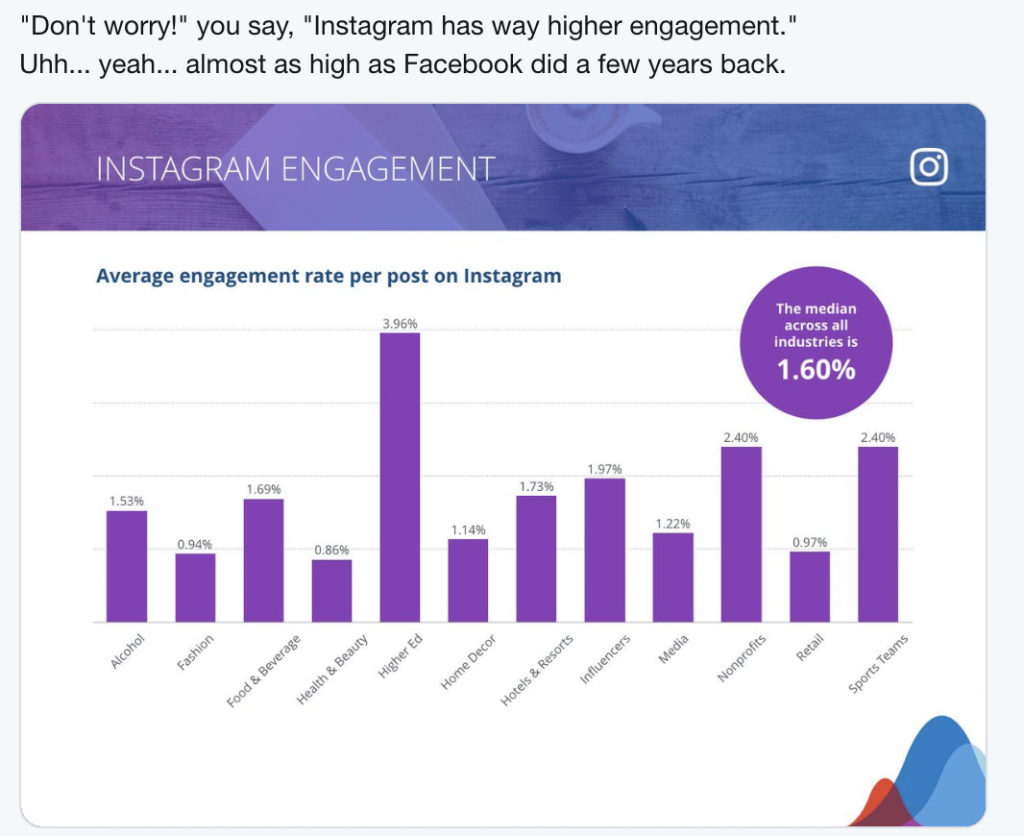
Compare the data above to Instagram engagement rates:

Conclusion
Follow the tips and insights supplied by the 2019 Social Media Industry Benchmark Report. And it would be beneficial if you know which industry you operate in so you can identify which golden nuggets are useful to your business.
As stated, avoid putting your eggs in one social media basket. You do not have to do away with Facebook if it still serves its purpose to some extent. However, do diversify your click sources. Moreover, look for the social network with the highest trust factor. And finally, choose the platform that allows you to engage well with your target audience.


